This SDB Update No. 1 on Australia is the start into EOMAP’s new post series on Satellite-Derived Bathymetry (SDB). Enjoy news, facts, and figures on a bi-weekly basis!
Mapping Australia’s coastline
Australia offers ~36,000 km with a further ~24,000 km of island coastlines. These coastal areas are fascinating, extremely manifold, and often highly dynamic. We have now completed SDB-mapping of the shallow waters “down under” in 100-m resolution. The continent is surrounded by the Pacific, the Indian, and the Southern (Antarctic) Oceans, and the shallow waters offer both challenging and ideal conditions for SDB:
- High-wave areas
- Rocky and sandy coasts
- Coral reefs
- Varied tidal ranges, including +10 m tides in the Northwest!
- Clear and turbid waters
- Strong sandbank dynamics, calling for frequent monitoring
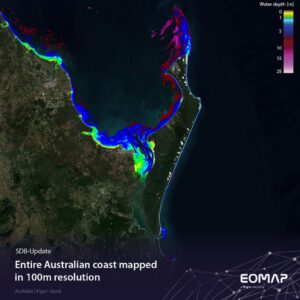
a detail of the 100 m resolution bathymetry result for the area of Great Sandy Straits on the east coast of Australia
100 m dataset
For this new dataset, we applied wave kinematics bathymetry and optical SDB processing. Both workflows based on Copernicus ECMWF Sentinel-2 satellite imagery. These data not only support environmental modelling. They also contribute to international initiatives such as Seabed 2030, EMODnet Bathymetry, or GEBCO – General Bathymetric Chart of the Oceans.
SDB-mapping in Australia by EOMAP
Our SDB activities ‘down under’ go a long way and include various ‘firsts’:
>> In 2009, we were the first to map Ningaloo (Nyinggulu), the world’s largest fringing reef in Western Australia in very high resolution.
Read more in the paper by Halina Kobryn et al..
>> In 2013, we provided the first very high-resolution SDB covering the entire ‘unmappable’ Great Barrier Reef.
Read more in this article at deepreef.org.
>> In 2019, the Australian Hydrographic Office adopted SDB in their survey toolbox. Meanwhile, EOMAP high-resolution data have been integrated into official Australian charts and AusSeabed bathymetry grids (30 m).
Contact
Get in touch with our Australian team for more success stories and SDB services in Australia and APAC.
Learn more about Satellite-Derived Bathymetry here.
Read our interview with the Former Hydrographer of Australia here.
Latest EOMAP News

Reuters bases Mekong article on EOMAP data

Cyanobacteria on the rise – algal blooms in bathing waters

SDB Update #7 – Topobathy of the Red Sea

SDB Update #6 – Satellite-based Topobathy Models

SDB Update #5 – Storymap on Satellite-Derived Bathymetry

SDB Update #4 – Northern Canada’s shallow waters mapped in 100 m
Related Posts

08 / 2025
SDB Update #7 – Topobathy of the Red Sea

07 / 2025
SDB Update #6 – Satellite-based Topobathy Models

07 / 2025
SDB Update #5 – Storymap on Satellite-Derived Bathymetry

06 / 2025
SDB Update #4 – Northern Canada’s shallow waters mapped in 100 m

06 / 2025
SDB Update #3 – The Maldives’ shallow waters mapped in 100 m

05 / 2025
SDB update #2 – The Bahamas mapped in 10 m

12 / 2024
COASTS – Projekt für widerstandsfähigere Küsten-Ökosysteme gestartet

12 / 2024
COASTS project launched to enhance coastal resilience and blue carbon ecosystems

10 / 2024
Hydrography project in Canada

09 / 2024
