EOMAP’s satellite-based water quality monitoring shows the extent of the flooding event in the Adriatic Sea in Italy
Heavy rainfall and strong winds have sparked extreme flooding in parts of Italy over the last two weeks. Italian regions have been counting the severe impact of the storms, particularly the six northern regions placed under red alert for several days.
EOMAP used Copernicus Sentinel-2 and Sentinel-3 satellite data sets for flood monitoring – measuring the turbidity levels caused by large river sediment inflows into the Adriatic Sea on Ocetober 31, 2018.
“Being able to assess the scale of flood damage using satellite data- even very small-scale flooded areas – is very useful for emergency services and local authorities,” said Karin Schenk, Senior Project Manager at EOMAP. “It can help to accurately assess the worst hit areas, allowing to make decisions about where best to direct needed resources.”
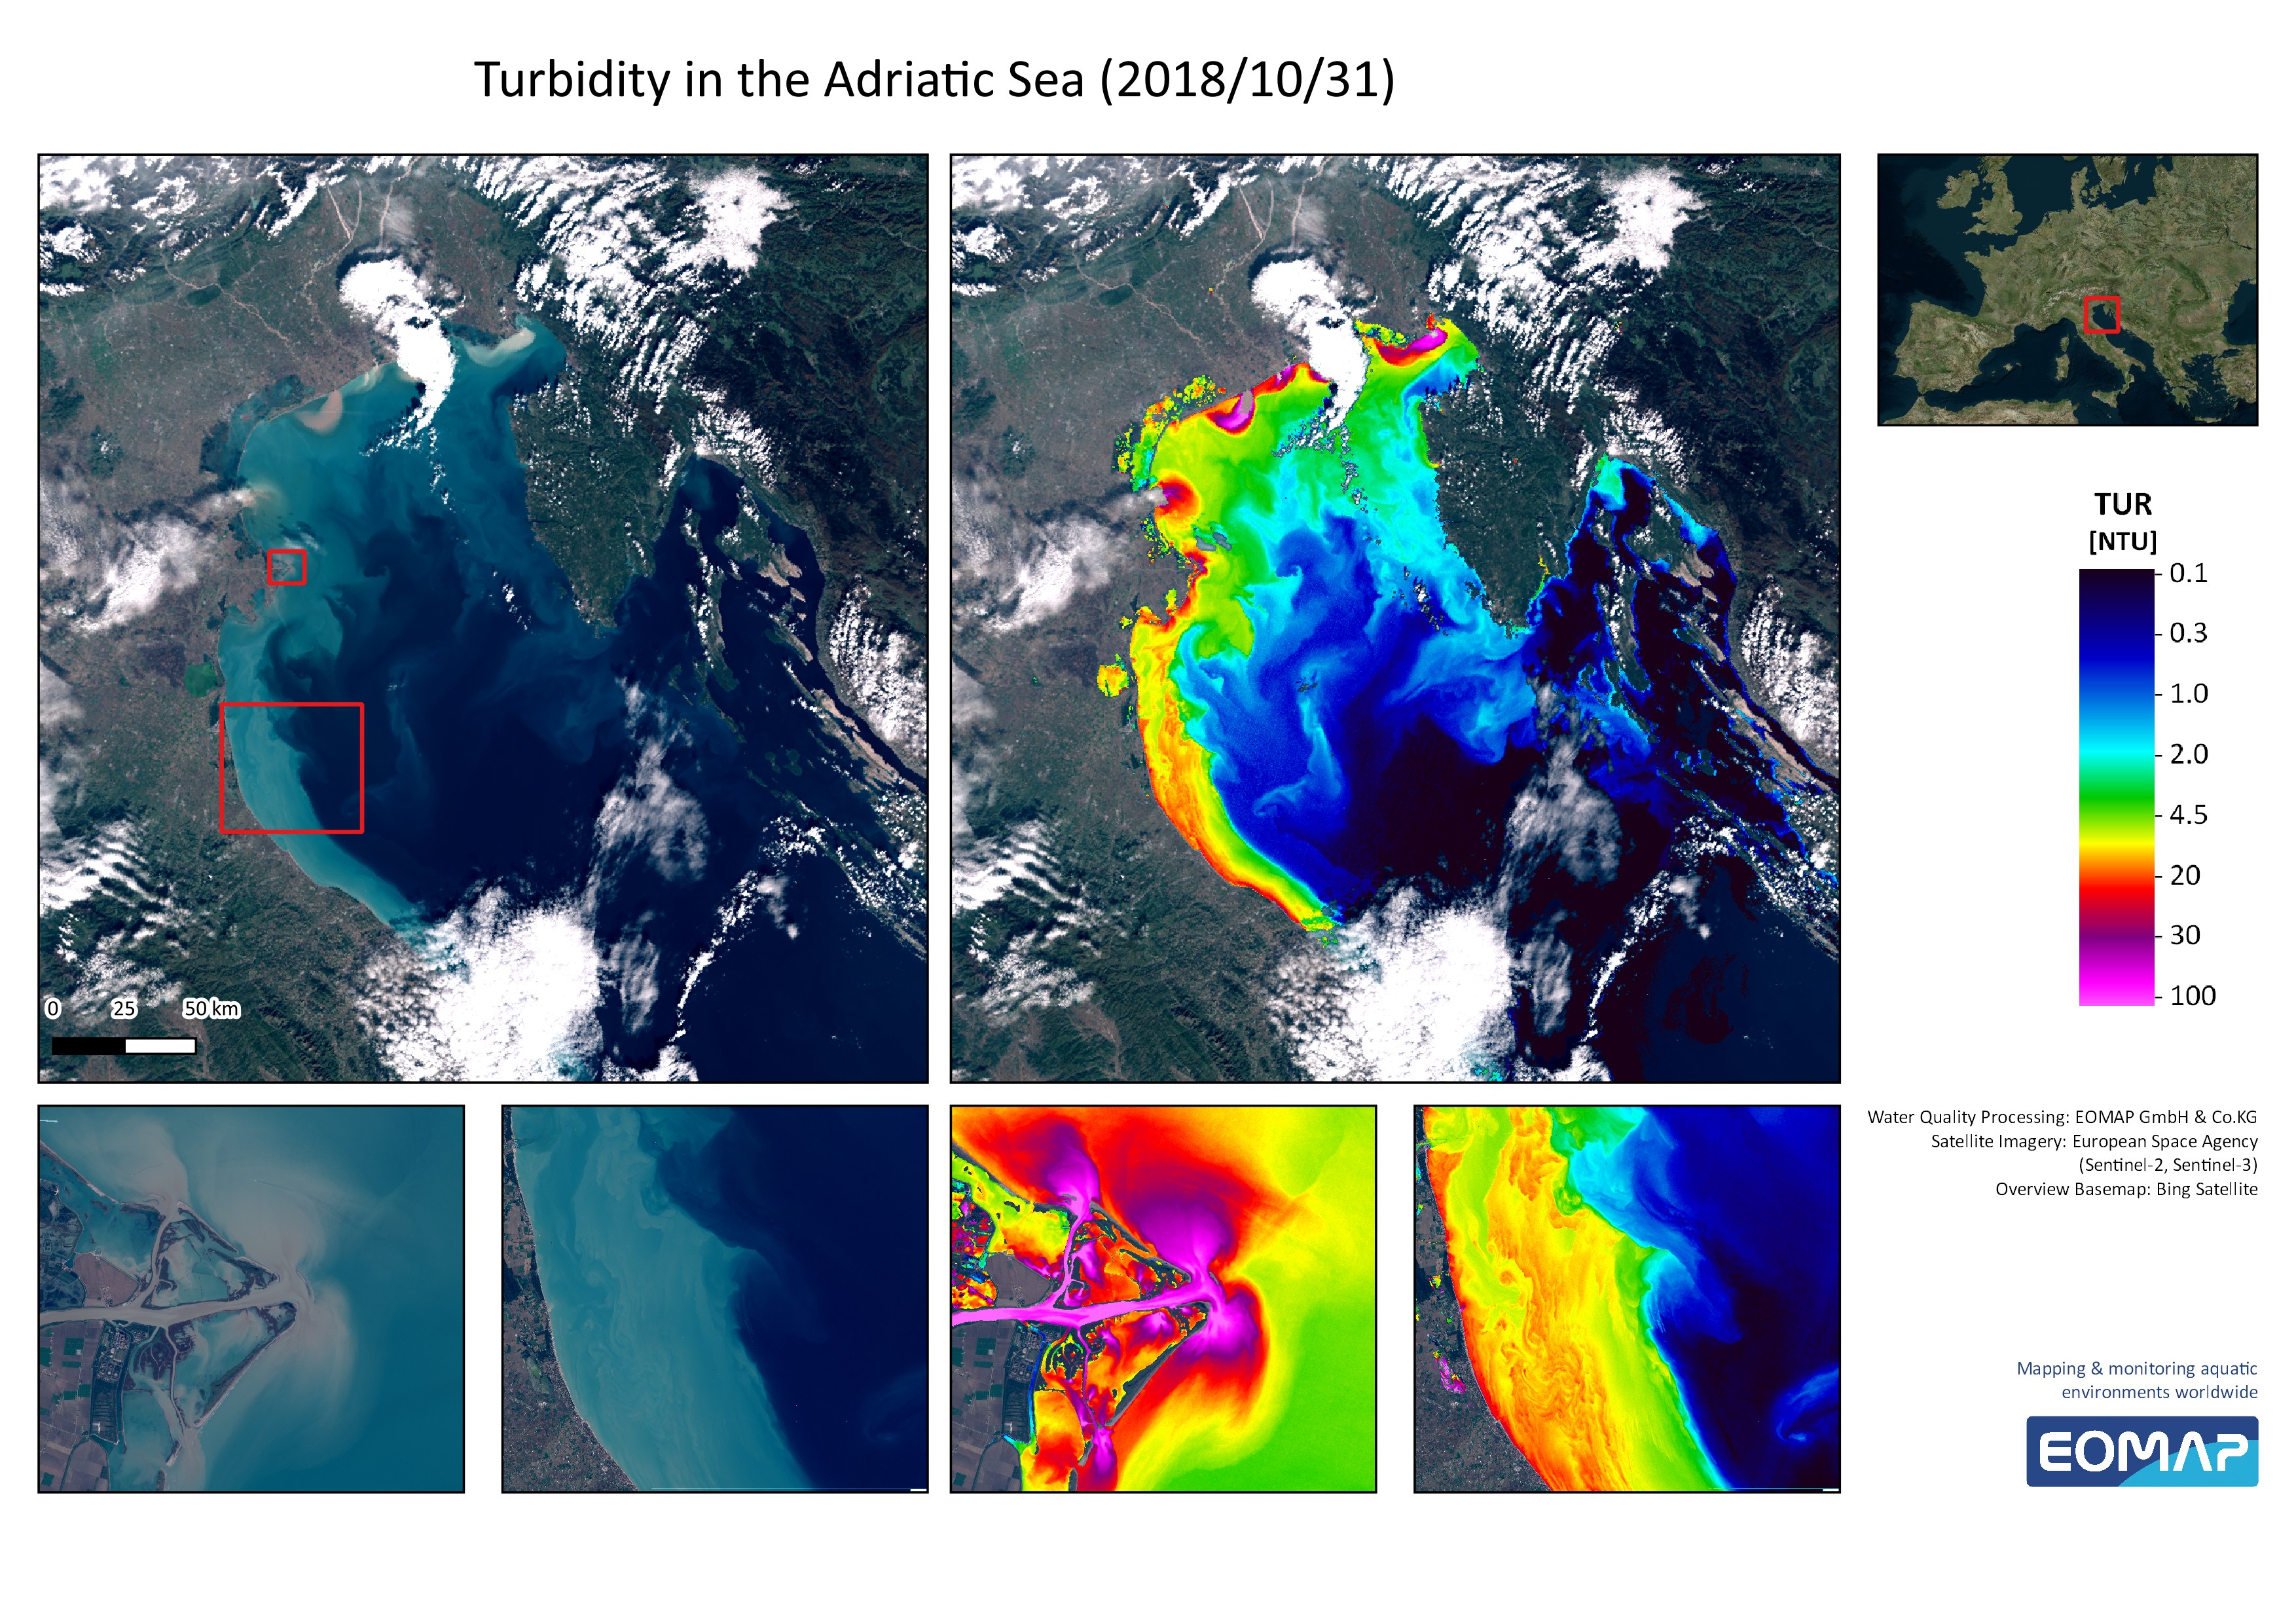
Left images, captured on October 31, 2018, show the large river sediment inflows into the Northern Adriatic Sea in “true” colour. The right images display the turbidity levels assessed with EOMAP’s EO processing system. © EOMAP 2018
Satellite data is useful for quickly assessing the extent of damage. It can also help to monitor and detect any changes or help to understand emerging problems that may be critical in the mid-term. That is why first responders and disaster relief programmes turn to satellite-based tools to help evaluate ground conditions.
“Satellite-based tools can provide one key step further by indicating how an excess rainfall event will impact river flow, and also whether there is a potential for flooding downstream away from the heavy rain event,” said Karin Schenk.
Where heavy rains unfold, floods follow. Satellite remote sensing is a powerful tool to map flooded areas.
“Satellite remote sensing is an efficient and cost-effective tool to assess a variety of physical and biological parameters in aquatic ecosystems over small-scaled and large areas and plays a very strategic role in maritime surveillance. Its ability to provide a detailed overview of the area is important in conducting on-going assessments and monitoring the extent of damage “, added Hendrik Bernert, EO Data Analyst at EOMAP.

Latest EOMAP News


Related Posts

01 / 2026
Space-based Intelligence for Clean Energy

01 / 2026
Pro-active hydropower management in winter

12 / 2025
A short recap of 2025

12 / 2025
From Climate to Nature and Biodiversity: Insights on COP30

12 / 2025
Water Crisis in Iran – Lessons to be learned

11 / 2025
Italian Webinar: Water Quality Monitoring from Space

10 / 2025
New Storymap: Bathing Water Monitoring from Space

09 / 2025
World Rivers Day 2025 – Using Satellite Data to Monitor Water Quality and River Health

08 / 2025
Cyanobacteria on the rise – algal blooms in bathing waters
05 / 2025
