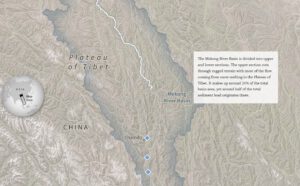
Reuters visualises the Mekong River’s way down to the estuary in Viet Nam.
In their graphic story “Starving the Mekong”, Reuters’ team shows the huge impact hydropower projects have on sediment flow along the Mekong River. By amazing visual storytelling they follow the longest river in Southeast Asia nearly 5,000 kilometres downstream from the Plateau of Tibet to the South China Sea.
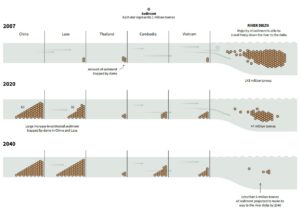
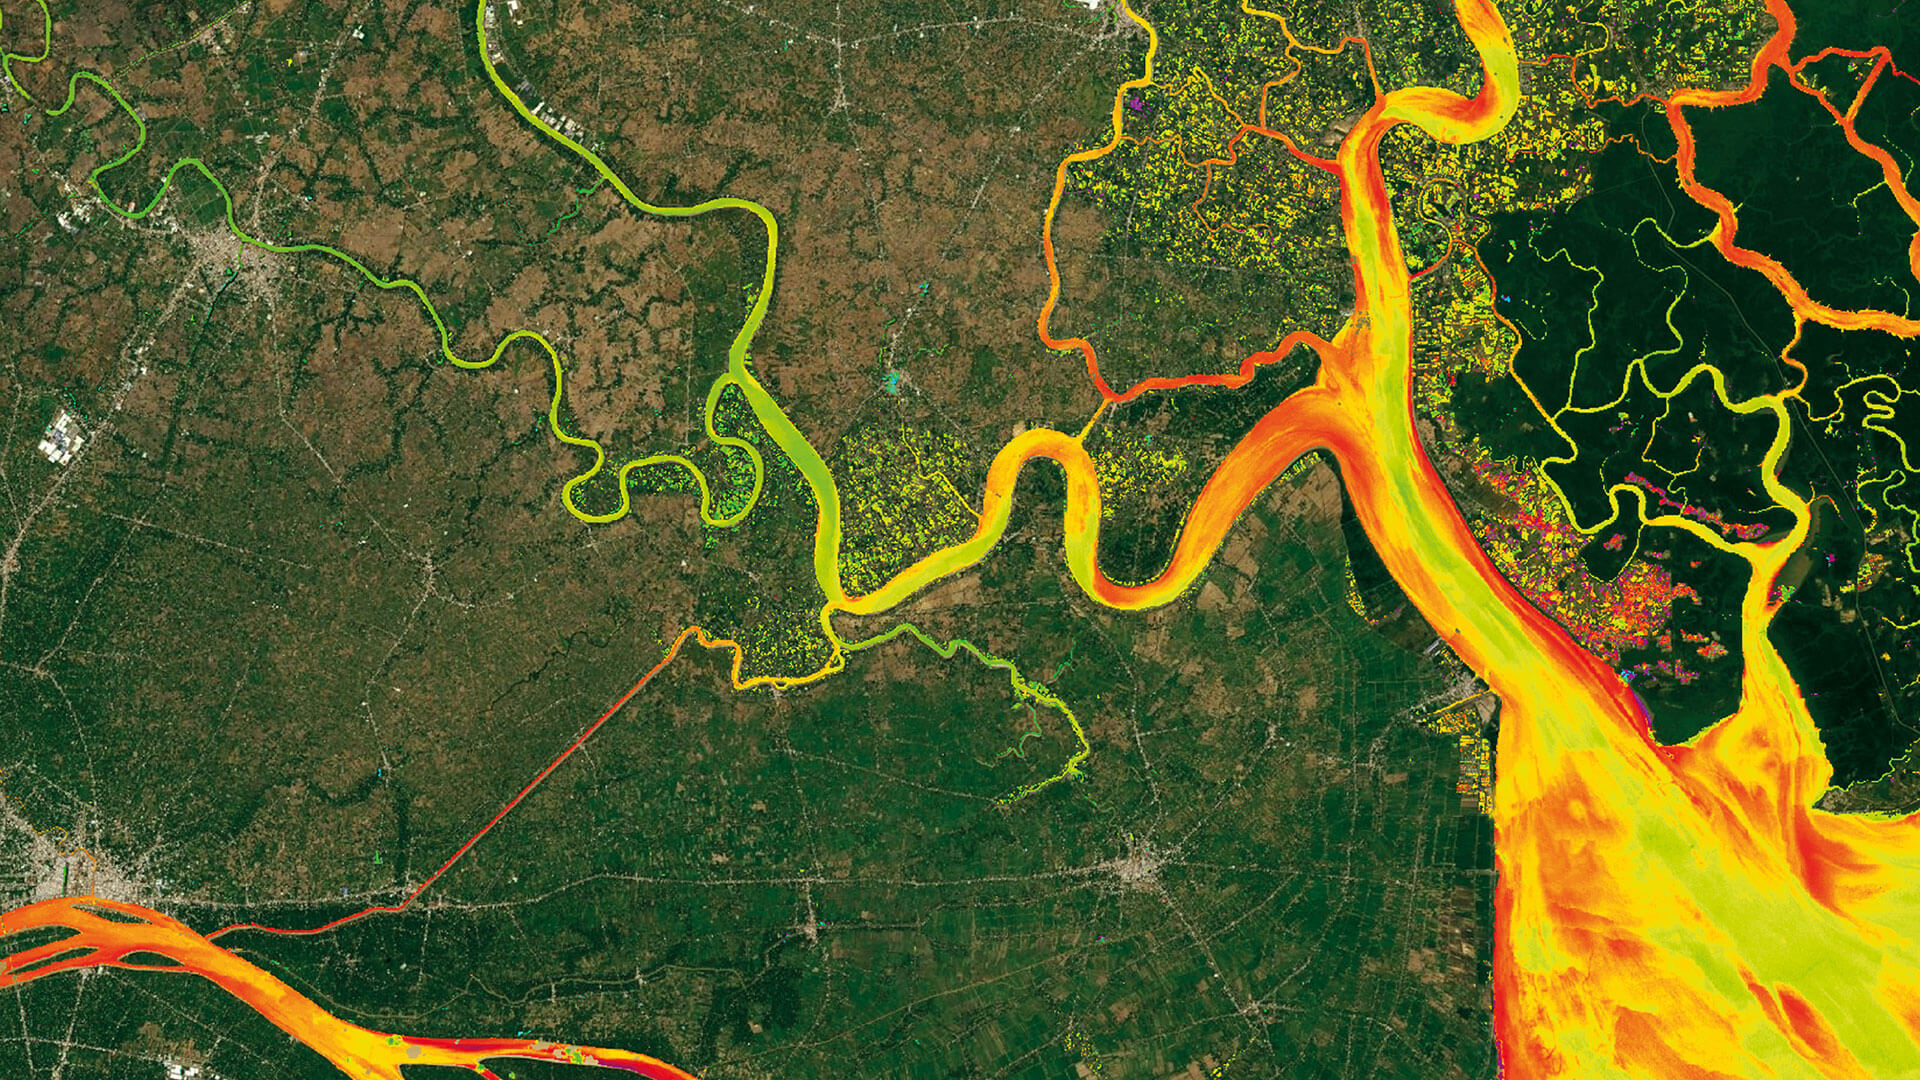
Reuters graphic showing the sediment trapped by hydropower dams along the Mekong River Basin
“Studies estimate that 96% of the sediment load will be trapped once all dams proposed in the Mekong Basin are in operation”, it says.
And this was EOMAP’s part: Together with Reuters we analysed over 1,500 satellite images around four major dams. Turbidity served as a proxy for sediment levels, an approach that we had validated on various rivers before.
🛰 In this case, like in many other river monitoring cases, the view from space offers 3 key advantages:
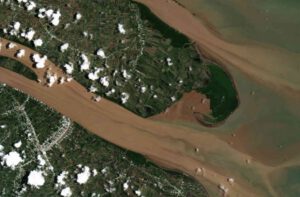
Turbidity shown in satellite images is used as a proxy for sediment load of rivers.
1. Go back in time: The images for the Mekong analysis date back to the 1990s, which “allows us to calculate turbidity levels before many of the dams were built,” says our data analyst Philipp Bauer.
2. Detect changes: Comparing data over three decades makes impacts on sediment flow visible.
3. Get the big picture: Geospatial data offer a view on the entire river catchment. It also enables to investigate the impacts of each cascade.
Christopher Howe of WWF has commented as follows: “Hydro dams may, in the right places, help reduce carbon emissions. But in the case of the Mekong they trap the life force of the river, the sediment. This increases the climate vulnerability of many millions of people, huge sectors of the economy of Cambodia and Viet Nam, and the incredibly valuable and diverse biodiversity of the region.”
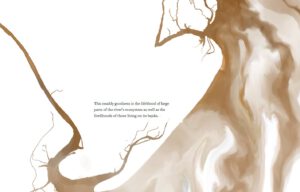
Reuters visual showing the “muddy goodness”
To reduce such drastic impacts, we have – together with European partners – developed a new toolbox. With HYPOS, we wish to support sustainable hydropower planning, for the sake of nature and people.
We congratulate Kanupriya Kapoor, Simon Scarr and their colleagues of Thomson Reuters on this great work.
Latest EOMAP News

Reuters bases Mekong article on EOMAP data

Cyanobacteria on the rise – algal blooms in bathing waters

SDB Update #7 – Topobathy of the Red Sea

SDB Update #6 – Satellite-based Topobathy Models

SDB Update #5 – Storymap on Satellite-Derived Bathymetry

SDB Update #4 – Northern Canada’s shallow waters mapped in 100 m
Related Posts

08 / 2025
Cyanobacteria on the rise – algal blooms in bathing waters
05 / 2025
Planet contract: Supporting Germany’s water monitoring
03 / 2025
German Innovation Prize 2025 – EOMAP listed among top 3

03 / 2025
Deutscher Innovationspreis 2025 – EOMAP unter den top 3

02 / 2025
Fugro acquires EOMAP

02 / 2025
Fugro erwirbt EOMAP
01 / 2025
Update der eoapp AQUA

01 / 2025
eoapp AQUA updated

12 / 2024
A short recap of 2024

12 / 2024
