Validation in use cases worldwide
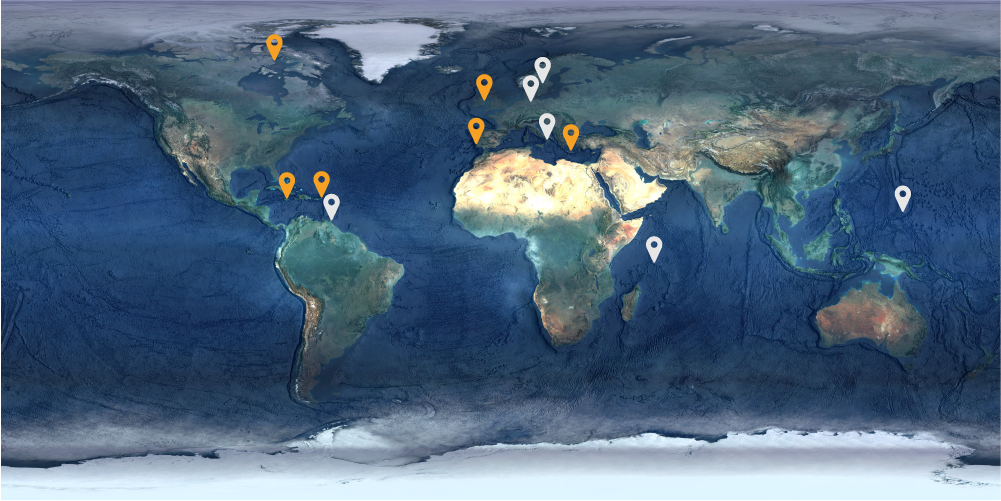
SDB-Online – developed within the 4S project – empowers coastal stakeholders to rapidly map and monitor shallow water environments – with the comfort of a desktop study. This concept has been applied and tested in 16 use cases in nine countries all over the world. For this purpose, SDB-Online created bathymetric surfaces in 10-meters spatial resolution for all of the sites. These bathymetric results were validated by comparison with in-situ data.
The selected use cases below showcase the proof of concept of SDB-Online for different mapping and monitoring environments:
Use Case Hooper Inlet, Canada
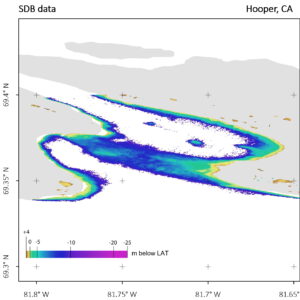
Satellite-Derived Bathymetry chart of the coast at Hooper, in the high latitudes of Canada
This use case showcases the validity of SDB-Online data in the high latitudes of Canada. The following two figures illustrate the SDB results and the scatterplot of SDB versus traditional bathymetry survey data.
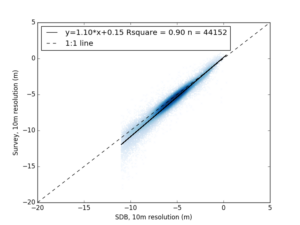
Scatterplot of bathymetry by SDB-Online validated against in-situ data of Hooper, Can.
For Hooper, Canada, SDB data were mapped from shoreline down to approximately 12 to 15 meters (LAT). The SDB in the very shallow waters allows to fill data gaps of the acoustic survey.
Interesting finding: On this site, a shoal could be identified and mapped in the SDB data (centre). Its spatial dimension was not present in the single beam echo sounder survey.
Use Case Dublin Bay, Ireland
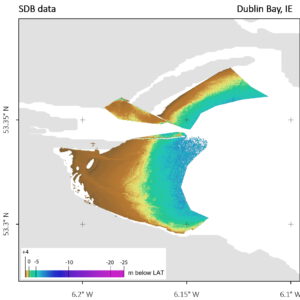
Satellite-Derived Bathymetry of Dublin Bay – c/EOMAP for S4
Dublin Bay use case shows the validity of SDB data in rather turbid waters. The following two figures illustrate the SDB results and the scatterplot of SDB versus traditional bathymetry survey data at the 4S use case in Dublin Bay, Ireland.
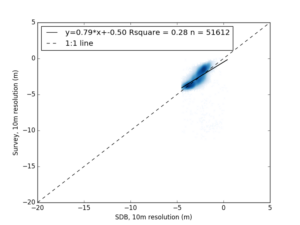
Validation scatterplot of SDB in Dublin Bay, IReland
Dublin Bay’s water clarity allowed to apply Satellite-Derived Bathymetry to map the seafloor down to 7.8 m at the time of satellite image recording. This equals to 5 meters below LAT, whereas the MBES survey data did not cover the intertidal depth.
Interesting finding: On this coastal site with higher turbidity, the combination of both surveys allowed for a seamless bathymetric grid from +3 meters LAT down to deeper water.
Use Case Sint Maarten, Dutch Antilles
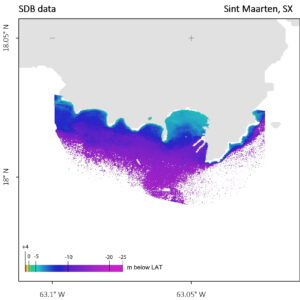
Satellite-Derived Bathymetry chart of Sint Maarten, SX – c/EOMAP for 4S
The use case of Sint Maarten – a coastline in the Caribbean – represented the water conditions with the clearest waters.
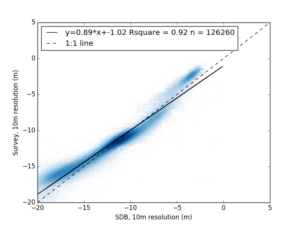
Validation plot of the use case in the Netherland Antilles.
The following two figures illustrate the SDB results and the scatterplot of SDB versus traditional bathymetry survey data at the 4S use case in the cristal clear waters of the Netherland Antilles.
The extremely high water clarity of these Caribbean waters allowed to apply Satellite-Derived Bathymetry to map the seafloor down to 20 meters depth.
Use Case Paros-Naxos Strait, Greece
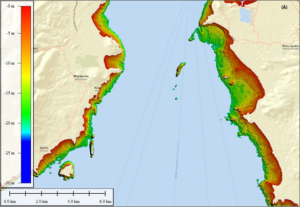
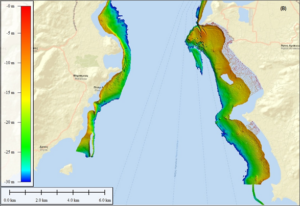
SDB data of the Paros–Naxos Strait, Greece.
This area in the Aegean Sea was selected by HCMR as a use case to demonstrate the application of 4S products, as it has clear water and extensive shallow areas. In addition, it is subject to human pressure, mainly related to tourism, shipping and fishing activities.
Field survey data of the Paros-Naxos Strait.
The area in the Cyclades island group is also ecologically valuable and thus included in the Natura network due to its remarkable habitat of Posidonia seagrass.
Similar to the other use cases, SDB and a new 4S bathymetric survey were compared.
The two maps illustrate the SDB results (left) complemented by validation data (right) along the Greek isles.
Interesting results were also achieved in transects at 11 different lines along the coast. The two graphs below show the (low) deviation of SDB from MBES data.
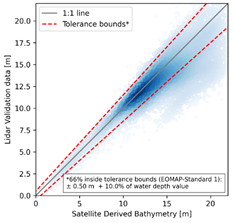
Comparison of measured and estimated depths and percentage of estimated depths (SDB) within the tolerance bounds of ±0.5m+10.0% water depth.

Comparison of SDB and 4S survey bathymetry along one of 11 transects at the Paros / Naxos strait.
Use Case Setúbal, Sado River, Portugal
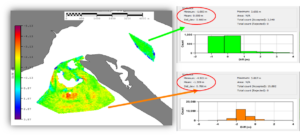
Sado River entrance and estuary: Comparing raw SDB data with acoustic data, using depth to 7m only (includes negative area), sandy rippled area and estuarine selected area.
The Sado, a major river in Portugal, is characterized by comparably low tidal influence and a shallow estuary. Instituto Hidrográfico provided a large data archive for this river, very helpful for testing and validating the 4S algorithm.
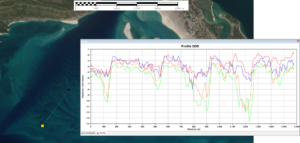
Sado River entrance and estuary: SDB profiles across time. They show, how consistent the results are on nearly consecutive days, and changes that occurred between two sets of data separated in time.
The following two figures illustrate the SDB results versus acoustic survey data in a use case with high turbidity and strong river dynamics.
The results clearly show that SDB is particularly useful in such dynamic areas for monitoring the evolution of the seafloor.
Falmouth - Trelawny, Jamaica
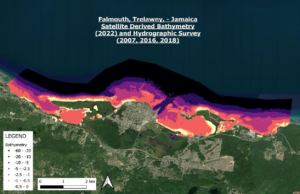
SDB bathymetry of Falmouth port (Jamaica) in 2022
In this use case, SDB data were tested for the application in hydrodynamic models to assess impacts of human activities in a touristic port. The Falmouth Cruise Ship Terminal is located on the north coast of Jamaica.
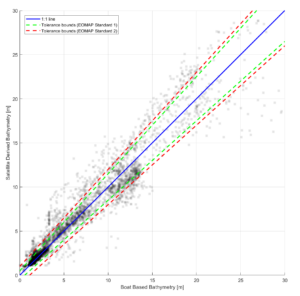
Comparison of measured and estimated depths within the tolerance bounds of ±0.5m+10.0% water depth (standard 1), ±1.0m+10.0% water depth (standard 2). Regression line in red, 1:1 line in dark blue and various tolerances lines in red dashed lines.
4S partner Smith Warner International (SWI) evaluated and assessed the dredge impacts through modelling of the coastal dynamics. One of the integral input elements to the coastal models was bathymetry; in this instance derived from published historical nautical charts, and traditional boat-based echo sounding surveys.
The accuracy of numerical model results is largely dependent on the surface model created from the interpolated bathymetry data set and thus is integral to achieving optimal model performance. This is ultimately demonstrated through validation of predicted against measured parameters. (see Scatterplot)
Read more about the robust technology behind SDB-Online.