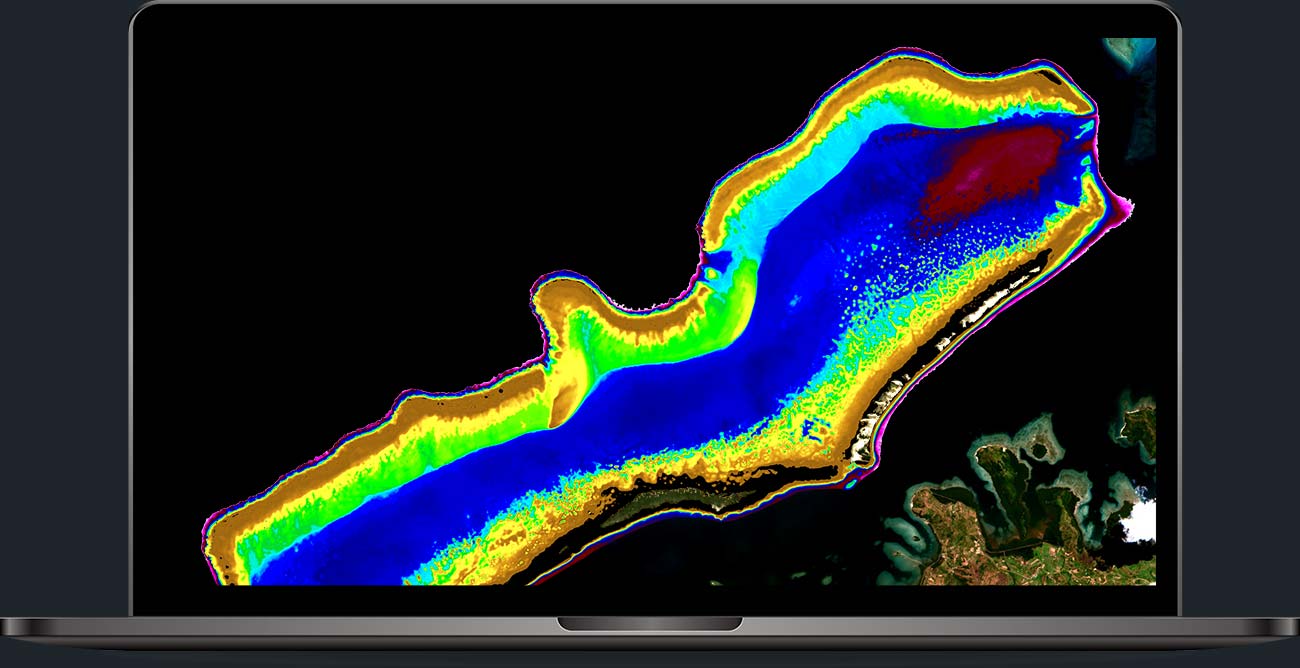
How your result could look
Satellite-Derived Bathymetry uses optical satellite sensors. It provides bathymetric data of shallow waters and enables continuous monitoring of nearshore changes. This improves bathymetric surveys, de-risks on-site operations, and is crucial for coastal zone management – on a local to global scale. With SDB, we have paved the way for a widely recognised bathymetric survey technique. – Unleash the power of this technology!

Bathymetry-related services
In addition to Satellite-Derived Bathymetry, you can count on further EOMAP expertise for your coastal projects: to better create seamless topography-bathymetry models, to characterise seabed habitats and coastal ecosystems, and to understand coastal and shoreline changes over time.
Why choose SDB by EOMAP?
Trust
Clients trust our solutions and services with a rating of 9 out of 10. Above all, they value our excellent customer service. Lately, the high reputation of our SDB solutions made Fugro acquire EOMAP.
Lead
Having pioneered in SDB and seabed mapping services over two decades, we were contracted by the European Commission for a global bathymetry dataset and serve both Seabed2030 and EMODnet. Our SDB data were the first worldwide to be integrated into a nautical chart.
Experience
Our team has been spearheading SDB technology and services for 20 years. About 100 projects per year range from small cable landing sites to pan-national coverage.
Feel this expertise from the first point of contact through professional expectation management, data analysis and project meetings!
Tech
For us, the inversion of the Radiative Transfer Equation (RTE), physics-based Satellite-Derived Bathymetry, hyper- and multispectral analysis, AI and ML tools for image interpretation, and skilled QA/QC are daily routines. For you, it might be enough to understand that it works!
Awards
We love what we do. However, we are pleased to see that EOMAP SDB solutions have been awarded with the Bavarian Innovation Prize, the Copernicus Tech Award and many other Earth Observation-related prizes throughout the years.

