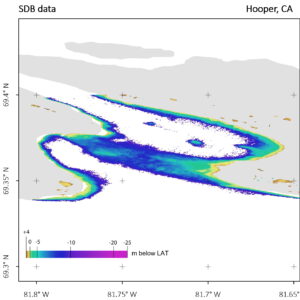
Satellite-Derived Bathymetry chart of the coast at Hooper, in the high latitudes of Canada
The following two figures illustrate the SDB results and the scatterplot of SDB versus traditional bathymetry survey data.
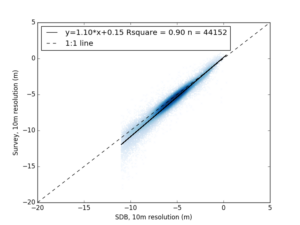
Scatterplot of bathymetry by SDB-Online validated against in-situ data of Hooper, Can.
For Hooper, Canada, SDB data were mapped from shoreline down to approximately 12 to 15 meters (LAT). The SDB in the very shallow waters allows to fill data gaps of the acoustic survey.
Interesting finding: On this site, a shoal could be identified and mapped in the SDB data (centre). Its spatial dimension was not present in the single beam echo sounder survey.